In 2024, the call center industry continued to evolve, but one metric remained consistently at the forefront: First Call Resolution (FCR). As one of the most critical key performance indicators (KPIs) in the call center industry, FCR measures a call center's ability to resolve customer issues or answer questions during the first interaction. Not only does FCR have a direct impact on customer satisfaction, but it also plays a pivotal role in improving operational efficiency and reducing costs.
In this blog, we will explore the 2024 FCR benchmark results across various industries, highlighting trends, challenges, and advancements. Whether you're in retail, telecommunications, healthcare, or any other sector, the goal is to help you understand where your call center stands and how you can enhance FCR to better serve your customers.
What is a Good FCR Rate?
Before diving into the 2024 FCR benchmark results by industry, it’s important to understand what constitutes a “good” FCR rate. First Call Resolution (FCR) is a metric that measures whether a customer's issue is resolved during their first interaction with the call center, eliminating the need for a follow-up call.
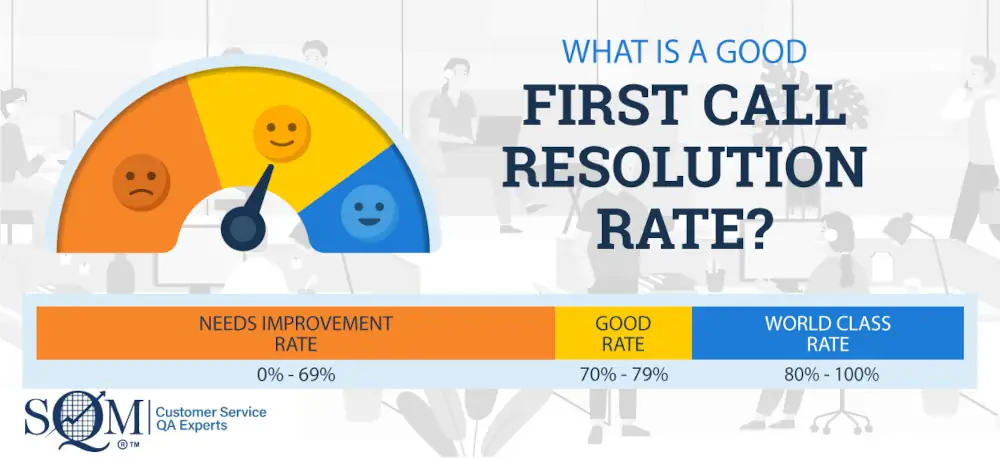
Based on years of research and benchmarking, SQM Group has found that a good FCR rate typically falls between 70% and 79%. Call centers achieving FCR rates within this range are performing well. These centers have established efficient processes, quality agent training, and effective problem-solving strategies that resolve most issues on the first call.
However, call centers aspiring to achieve world-class performance aim for an FCR rate of 80% or higher. This standard is difficult to attain, but those who do reach it reap significant rewards in terms of customer satisfaction, loyalty, and reduced operational costs. In fact, SQM research shows that every 1% improvement in FCR can result in $286,000 in annual savings for a typical midsize call center.
To put your FCR performance into perspective, it’s helpful to benchmark against industry peers. By comparing your call center’s FCR rate to that of other organizations in the same sector, you can identify whether you’re meeting industry standards or if there are areas for improvement. It’s also essential to consider world-class call centers, as their processes, technologies, and strategies can serve as inspiration for achieving top-tier results.
While there is no universal FCR “perfect score,” call centers should strive to meet the standards set within their own industry, keeping in mind that different industries have different challenges. For instance, retail call centers may see higher FCR rates due to less complex calls, whereas telecommunications or technical support centers may face more complex issues that require longer handling times and specialized expertise.
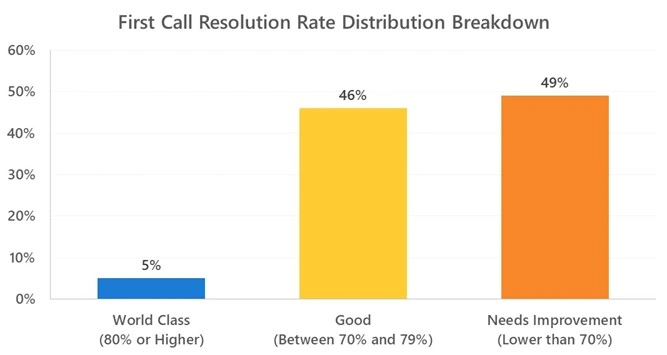
Our FCR benchmark research shows that only 5% of call centers perform at the world-class FCR rate standard of 80%. World-class performing call centers create higher customer referrals and retention. For example, every 1% improvement in the FCR rate increases the interactional Net Promoter Score by 1.4 points for the average call center. Furthermore, when FCR is achieved, 95% of customers will continue to do business with the organization. In general, the higher the FCR rate, the better.
In the following sections, we will delve into the 2024 FCR benchmarking results across different industries, highlighting key trends, challenges, and areas where call centers can improve.
2024 FCR Benchmark by Industry
Understanding FCR performance across different industries is crucial for identifying strengths and weaknesses in your call center. The FCR rate can vary significantly depending on the complexity of the calls, the technology used, and the resources available to agents.
For over 25 years, SQM Group has been at the forefront of measuring, benchmarking, and tracking First Call Resolution (FCR) to help top North American call centers enhance customer service and FCR performance. We annually benchmark FCR rates for over 500 leading North American call centers using a Voice of the Customer (VoC) approach, which is recognized as the gold standard for accurate and consistent FCR measurement.
To ensure the reliability and relevance of our benchmarks, we follow a highly standardized approach when measuring FCR across all participating centers. This method allows call center managers to make meaningful comparisons between their own performance and that of their industry peers, as well as world-class call centers. Here’s an overview of the practices we use to ensure the accuracy and usefulness of our FCR benchmarks:
- FCR benchmarks are compared across industry peers, averages, and world-class North American call centers.
- High-level metrics on call center FCR and repeat call rates are provided.
- The FCR rate is calculated based on two customer survey questions during our external post-call surveys.
- Only inbound customer service call centers are included in our benchmarking data.
- We include only industries with more than 10 call centers being benchmarked.
- Each call center participant’s data is based on a minimum sample size of 400 surveys.
- All survey questions regarding FCR are standardized and consistent across participants.
- Surveys are conducted within one business day of the customer interaction to ensure freshness and accuracy.
- SQM’s in-house telephone survey agents administer post-call surveys.
- Quality assurance auditors and speech recognition technology are employed to verify the accuracy of survey responses.
2024 FCR Benchmark Results by Industry
This section will break down the FCR performance for key industries in 2024 based on our latest benchmarking data. By comparing your call center’s performance to that of your industry peers, you can gain actionable insights into where your center stands and identify opportunities for improvement.
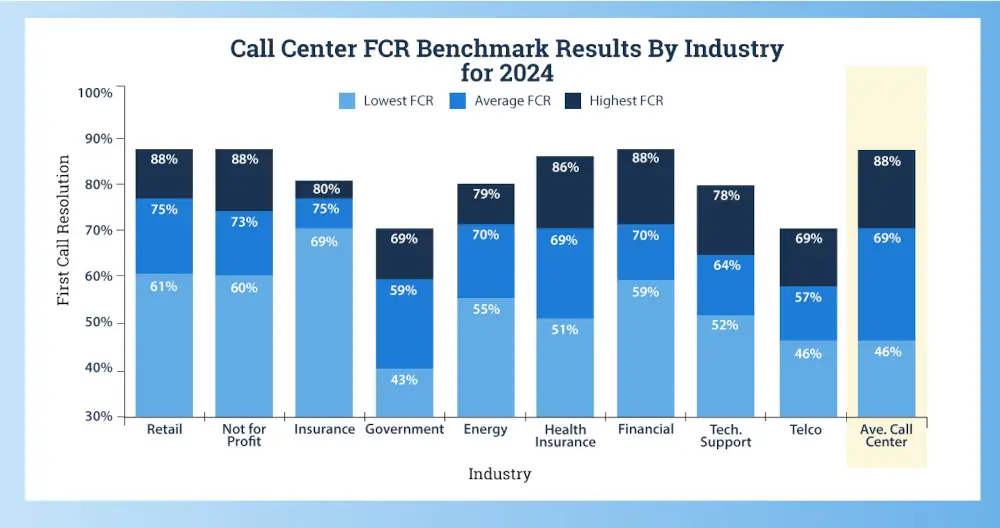
The aggregated FCR average across all industries was 69%. The FCR rate ranges from 43% to 88%. It is surprising to see the average FCR was only 2% lower than the previous year, given that 85% of agents work from home (WFH), and there has been a 34% annual agent turnover. WFH and agent turnover percentages are approximately double from pre-covid.
Retail, Not-for-profit, and Insurance industries' call centers lead the pack with a good FCR rate average of 73-75%. Interestingly, most industries have a company's call center performing at the world-class FCR standard of 80% or higher FCR rate. Since most industries now have at least one call center achieving world-class FCR performance, this supports the idea that even call centers handling complex issues can reach world-class FCR levels.
It’s not surprising that retail call centers are industry leaders in FCR performance, given the relatively low complexity of their calls. On the other hand, it’s impressive that insurance call centers also achieve high FCR rates despite dealing with moderate to high call complexity.
Call centers in sectors like energy, health insurance, and financial services generally maintain a moderate or lower-level good FCR rate. Over the past five years, FCR rates in these industries have remained relatively unchanged. However, these sectors continue to be key drivers for innovation, introducing new people, processes, and technologies that influence and improve customer service across all industries.
In contrast, technical support, government, and telecommunications call centers still face challenges with their FCR rates, which remain in the "needs improvement" category. Despite SQM's over 25 years of benchmarking, no telecommunications company has ever achieved world-class FCR performance. This gap presents a significant opportunity for telecom call centers to enhance their FCR rates, ultimately improving the customer experience across the entire organization.
FCR Performance Comparison by Call Type
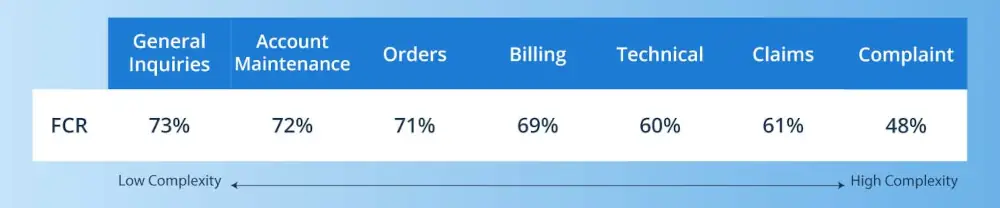
The below chart illustrates the comparison of FCR performance by call type. For example, the data shows that general inquiries have the highest FCR rate at 73%, followed by account maintenance at 72%, orders at 71%, and billing at 69%. On the other hand, claims calls have an FCR rate of 61%, technical support at 60%, and complaints have the lowest FCR rate at 48%.
In many call centers, call types such as inquiries, account maintenance, orders, and billing tend to have low to moderate complexity, typically resulting in higher-than-average FCR performance. In contrast, call types like billing, technical support, claims, and complaints often involve moderate to high complexity, leading to lower FCR performance. It’s important to note that some call centers are able to achieve world-class FCR standards across all call types—except for complaint calls, which continue to be more challenging.
A general guideline used by SQM to assess call complexity includes factors such as average handle time (AHT), training level for new hires and experienced agents, call flow, and the effectiveness of desktop applications. Another key factor in call complexity is the emotional aspect of the interaction, particularly for customers calling with complaints.
SQM's research reveals that the average AHT (including talk time and wrap-up time) for call centers participating in our benchmarking study is 697 seconds, reflecting an 18% increase from the previous year. The FCR rate is also impacted by the length of the call. For instance, calls lasting between 1 to 3 minutes achieve a 3% higher FCR rate than calls between 5 to 10 minutes, which most calls in the call center industry fall between. Calls lasting around 15 minutes have an FCR rate 5% lower than 5 to 10 minutes calls.
Root Causes Hindering High FCR
A common question we hear at SQM is, "What prevents call centers from improving or achieving a high First Call Resolution (FCR) rate?" There are multiple factors that can hinder progress, but a crucial first step is conducting a root cause analysis of non-FCR interactions by identifying and examining repeat call reasons.
Identifying and Analyzing Repeat Call Reasons
To effectively analyze repeat call reasons, use the following approaches:
- Conduct Post-Call Surveys: After each call, ask customers why their issue wasn’t resolved on the first call, and tag the feedback according to the reason for the repeat call.
- Examine Non-Resolved Calls: Review why certain calls aren’t resolved during the first interaction.
- Analyze Trends: Look for patterns from both external (customer surveys) and internal (call data) FCR measurement methods.
- Identify High-Risk Call Types: Focus on call types with the highest repeat call rates, such as technical support, claims, orders, and inquiries.
- Target Improvement Opportunities: Find specific areas where repeat call reasons can be reduced.
- Assess Customer Satisfaction: Determine why customers were unsatisfied with the solutions provided.
- Understand Transfer and Escalation Reasons: Investigate why calls need to be transferred or escalated to another representative or manager.
Analyzing the Root Causes of Repeat Calls
Once repeat call reasons are identified, the next step is to examine the root causes. Some common issues to consider include:
- Organizational Policies and Procedures: Are there internal processes that prevent FCR?
- Customer Confusion or Issues: Do customers face difficulties that prevent resolution on the first call?
- Agent Tools and Resources: Are agent desktop applications or resources inadequate to resolve issues efficiently?
- Agent Skills and Knowledge: Do agents have the necessary training, skills, and knowledge to resolve calls effectively?
- Agent Coaching and Motivation: Do agents receive the coaching and support needed to handle calls well? Are they motivated and recognized for resolving issues?
- Call Handling Practices: Are agent behaviors, such as talk time, wrap-up time, transfers, or holds, hindering FCR?
- Source of Error: Who is responsible for non-FCR calls—agents, customers, or the organization? Identifying the source of error can help direct focus on the areas that need the most improvement.
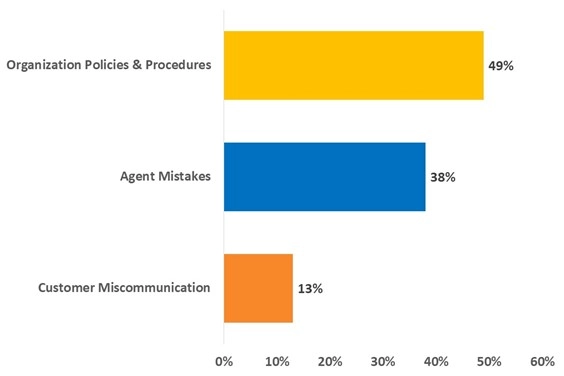
Source of Errors in Non-FCR Calls
SQM's research reveals that the source of error (SoE) for non-FCR calls breaks down as follows: 38% of errors are attributed to the agent, 13% to the customer, and 49% to the organization.
Our findings suggest that the most significant improvements in FCR typically come from addressing errors caused by agents and customers. As a result, the most effective way to enhance FCR performance in most call centers is by reducing agent-related errors. While there are instances where reducing organizational errors can lead to FCR improvements, this approach is less common and tends to take longer to implement.
Given that organizational errors account for 49% of non-FCR calls, it's essential for call centers to collaborate across departments to identify failure points and develop targeted action plans for improvement. However, if your call center is seeking quicker results, focusing on reducing agent and customer errors should be prioritized before addressing organizational ones.
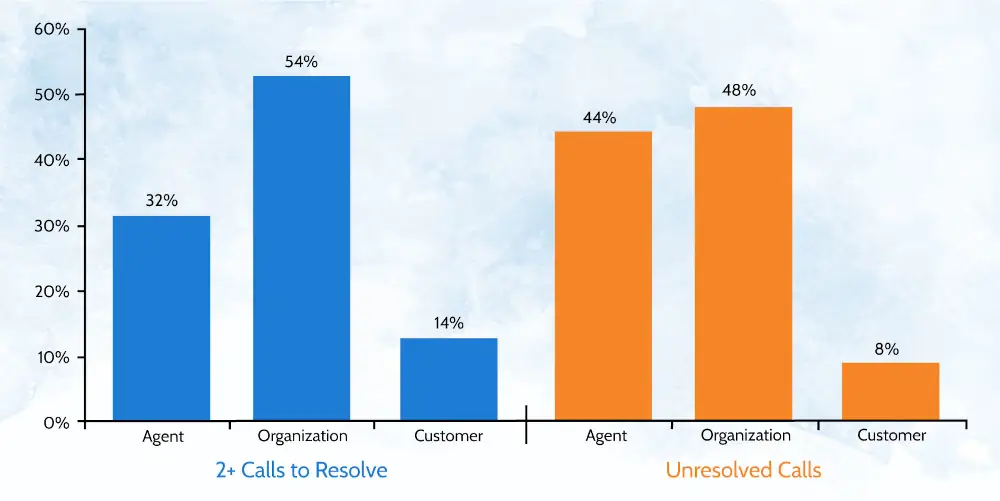
Errors in Two or More Call Interactions
For calls that are resolved but require two or more interactions, the organization is typically the source of error 54% of the time, which is significantly higher than the 32% attributed to agents in these situations. When calls remain unresolved, the agent is the primary source of error, accounting for 44% of cases.
Agents need to recognize that they are often the main factor in unresolved calls. Despite this, SQM's experience shows that agents frequently perceive organizational issues as the primary cause of failure rather than their own actions. To improve FCR, agents must be held accountable for call resolution, especially since the call center is the final point of contact to prevent customer attrition.
SQM's research identifies the top five root causes behind repeat calls that prevent delivering excellent customer service and achieving First Call Resolution:
- The customer needed to check or verify the status of their unresolved issue.
- The customer was disconnected while on hold.
- The agent lacked the knowledge or resources to resolve the issue.
- The customer's request was not fully completed.
- The customer was redirected to another company.
To achieve or improve First Call Resolution, call center leadership must fully commit to enhancing the support experience for agents and customers. It’s crucial to identify the underlying causes of sources of error (SoEs) and the reasons for the repeated calls contributing to non-FCR calls to implement targeted improvements.
FCR Improvement Action Plan
Gartner reports that 95% of companies collect customer feedback, but only 10% use it to drive improvements, and just 5% share the changes with customers. When customers take the time to provide feedback to help call centers enhance their service, organizations should close the loop. Put simply, after collecting customer feedback, organizations must act on it.
The Voice of the Customer (VoC) closed-loop improvement process is a proven strategy for developing an action plan to continuously improve FCR. Once you've measured your FCR performance and identified the root causes of repeat calls, it’s time to create an actionable plan to enhance FCR.
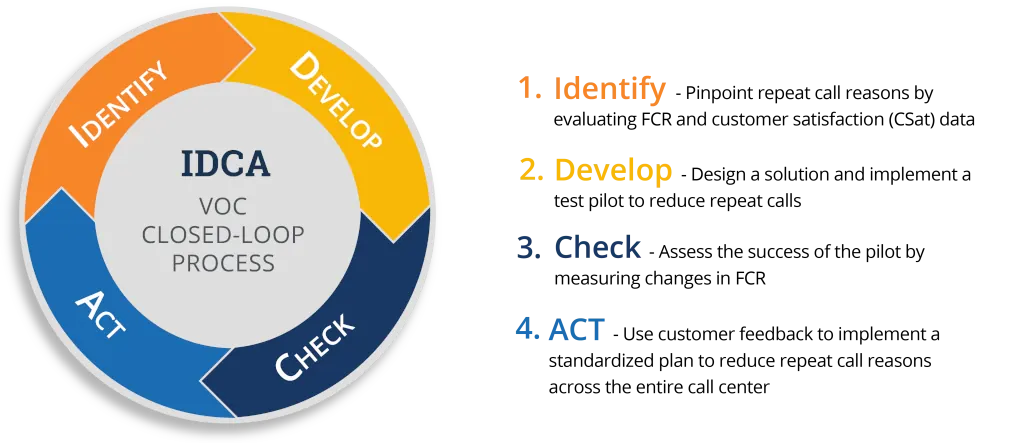
To ensure continuous FCR improvement, call centers should adopt the Identify, Develop, Check, and Act (IDCA) Closed-loop Improvement Cycle. This four-step cycle helps you measure, benchmark, and improve FCR performance effectively:
- Identify – Pinpoint repeat call reasons by evaluating FCR and customer satisfaction (CSat) data.
- Develop – Design a solution and implement a test pilot to reduce repeat calls.
- Check – Assess the success of the pilot by measuring changes in FCR.
- Act – Use customer feedback to implement a standardized plan to reduce repeat call reasons across the entire call center.
4.6
 Stars on G2 for mySQM™ Auto QA Tool Reviews


What Differentiates SQM from its Competitors is our...
mySQM™ Automated QA/CX Analytics Solution that uses proprietary AI technology and intellectual property to determine QA scores and predict customer satisfaction with up to 95% accuracy for every call. SQM's Post-Call Customer Satisfaction Prediction QA Model - Is a Game-Changer!
SQM's QA and CSat scores can be used to benchmark against leading call centers. Analyze 100% of customer calls with our auto QA/CX solution.
Furthermore, mySQM™ QA/CX provides agents with self-coaching, self-training, and real-time financial recognition features for calls evaluated to help monitor, motivate, and manage agents to deliver great customer satisfaction.