Effective performance measurement is essential for improving call center customer satisfaction and operational efficiency. One of the best ways to do this is through Key Performance Indicators (KPIs), which allow call center managers to track, analyze, and optimize service quality.
In this blog, we'll explore the top 12 KPIs every call center should track and offer actionable tips for improving them. From First Call Resolution to Agent Utilization, these KPIs provide insights into customer satisfaction, agent performance, and overall call center productivity.
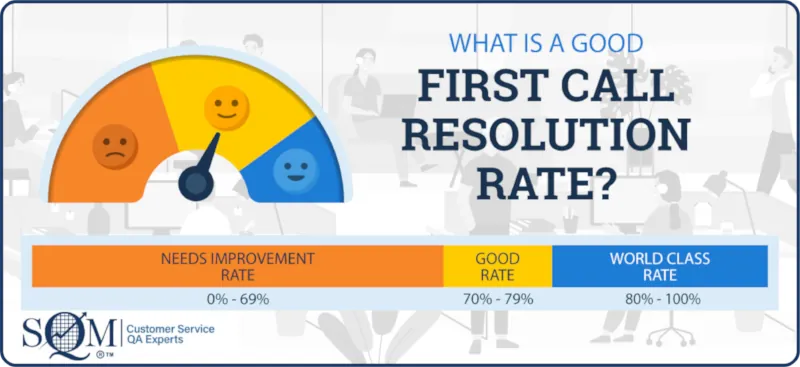
1. First Call Resolution Rate
First Call Resolution (FCR) is a metric that measures a call center's performance for resolving customer interactions on the first call or contact, eliminating the need for follow-up contacts.
FCR is one of the most powerful indicators of a call center's effectiveness. Customers value getting their issues resolved quickly and without having to contact the company multiple times. High FCR rates lead to reduced customer frustration and increased loyalty. Additionally, it cuts down on repeat calls, thus freeing up resources and lowering operational costs.
For example, a customer calls to report an issue with their internet connection. If the agent can resolve the problem during that first call, the interaction is marked as a successful FCR. However, if the customer has to call back later because the issue wasn't fully addressed, it counts as a failed FCR.
To improve FCR, call center managers should focus on agent training and provide tools that help agents easily access customer information and knowledge bases. Additionally, empowering agents to make decisions on the spot (when appropriate) can reduce the need for transfers or escalations. Regularly tracking FCR performance and identifying common unresolved issues can also help improve processes and training.
2. Customer Satisfaction Score
The Customer Satisfaction Score (Csat) measures customer satisfaction after an interaction with the call center. It is typically gathered through a survey that asks customers to rate their experience on a scale (often from 1-5 or 1-10). Csat directly measures how well your call center meets customer expectations in real-time.
For example, after a customer completes a call with an agent, they might receive a follow-up email or text message asking them to rate the service on a scale of 1-5. A response of 4 would be considered a good Csat score, while a 1-2 would indicate dissatisfaction.
To improve Csat, it's essential to collect feedback from as many customers as possible. Use surveys that are short, simple, and easy to complete. Once the feedback is collected, analyze it for trends to identify common pain points and agent performance gaps.

4.6
 Stars on G2 for mySQM™ Auto QA Tool Reviews


What Differentiates SQM from its Competitors is our...
mySQM™ Automated QA/CX Analytics Solution that uses proprietary AI technology and intellectual property to determine QA scores and predict customer satisfaction with up to 95% accuracy for every call. SQM's Post-Call Customer Satisfaction Prediction QA Model - Is a Game-Changer!
SQM's QA and CSat scores can be used to benchmark against leading call centers. Analyze 100% of customer calls with our auto QA/CX solution.
Furthermore, mySQM™ QA/CX provides agents with self-coaching, self-training, and real-time financial recognition features for calls evaluated to help monitor, motivate, and manage agents to deliver great customer satisfaction.

Providing agents with the tools to solve customer issues efficiently and empathetically can also lead to higher Csat scores. Additionally, taking the time to personally follow up on negative scores can show customers that their opinions matter, ultimately boosting satisfaction in the long term.
3. Net Promoter Score
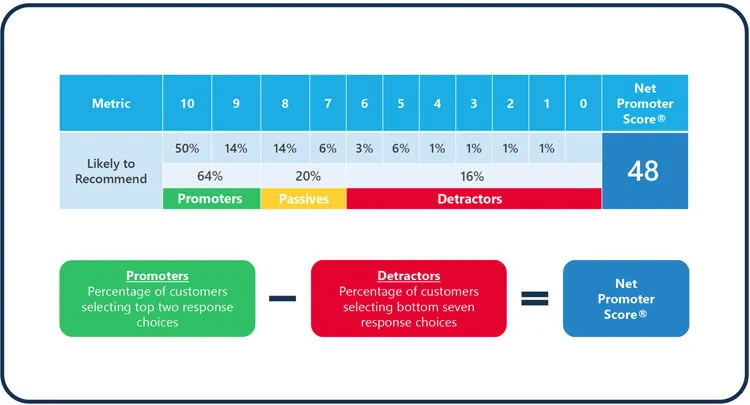
Net Promoter Score (NPS) measures customer loyalty by asking, "How likely are you to recommend our service to a friend or colleague?" Respondents rate this on a scale from 0-10, categorizing them as promoters (9-10), passives (7-8), or detractors (0-6).
NPS helps gauge long-term customer satisfaction and loyalty, making it a critical metric for growth. A high NPS indicates that customers are happy with your product or service and willing to promote your brand to others.
To improve your NPS, engage with promoters to build brand loyalty, address issues from detractors, and use feedback to improve customer service continuously.
4. CX Sentiment
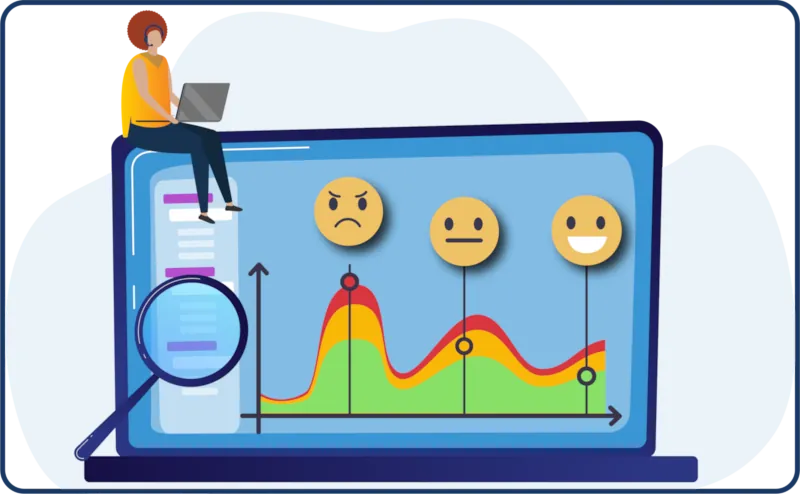
CX Sentiment tracks the overall emotional tone of customer interactions, whether positive, neutral, or negative. This can be measured using direct feedback, social media mentions, or AI-powered sentiment analysis tools. Understanding CX sentiment allows call centers to address negative feelings and foster positive emotions, directly impacting customer satisfaction and loyalty.
For example, a customer's review expressing frustration about a delayed response would show negative CX sentiment, while praise for a quick resolution would reflect positive CX sentiment.
Implementing sentiment analysis software to monitor real-time customer emotions can help your call center improve CX sentiment. Training agents to recognize and respond empathetically to negative sentiment can boost CX sentiment. This includes training agents on active listening skills, tone of voice, and empathy statements.
5. Repeat Call Rate
Repeat Call Rate (RCR) is the percentage of customers who call the center multiple times for the same issue. A high rate often indicates unresolved issues or poor service quality and can usually be attributed to gaps in agent training.
On the other hand, low repeat call rates suggest effective problem-solving and are typically associated with well-trained agents and a more efficient call center. Reducing repeat calls enhances customer satisfaction and reduces operational costs.
For example, if a customer needs to call back to follow up on an unresolved billing issue, it counts as a repeat call.
To reduce RCR, it's essential to prioritize FCR by ensuring that agents are well-equipped to handle a wide range of customer issues on the first call. Regularly updating training materials and knowledge bases will ensure agents have accurate and up-to-date information. Additionally, empowering agents with decision-making authority to resolve common issues can prevent the need for escalation or follow-up.

6. Call Abandonment Rate
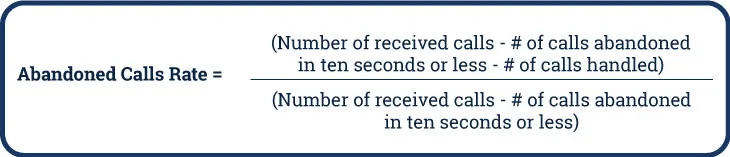
The Call Abandonment Rate measures the percentage of calls where customers hang up before speaking with an agent. This often occurs when the wait times are too long or customers are frustrated with the call routing system. Call abandonment rates of less than 5% are considered good.
A high abandonment rate suggests poor customer experience and call routing or staffing inefficiency. Customers who abandon calls are likely to be dissatisfied and may choose to take their business elsewhere.
For example, if customers wait in a queue for more than 10 minutes and then hang up without speaking to an agent, this counts as an abandoned call.
To reduce abandonment rates, focus on improving call routing using Interactive Voice Response (IVR) systems to direct customers efficiently. Additionally, adequate staffing must be ensured during peak times to reduce wait times. A callback option can also help mitigate long hold times, improving the customer experience.
7. Service Level & Response Time
Service Level refers to the percentage of calls answered within a specific timeframe, usually 30 seconds. Response time measures how quickly agents address customer inquiries once the call is answered.
Service level and response time are critical for customer satisfaction. Long wait times lead to frustration, while quick responses create a more positive customer experience. Meeting these targets ensures that customers don't feel neglected or rushed.
For example, if your target is answering 80% of calls within 30 seconds and you hit that goal, your service level meets customer expectations.
To enhance service level, analyze call volume patterns and adjust staffing accordingly. Implementing workforce management software can optimize scheduling. Additionally, prioritize streamlining processes to ensure faster responses, such as providing agents easy access to customer information and solutions.

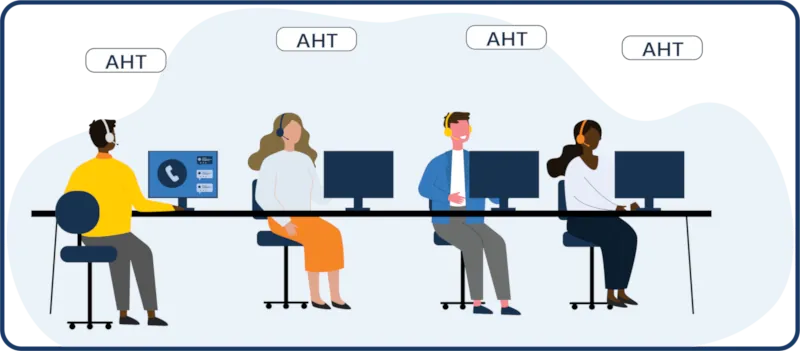
8. Average Handle Time
Average Handle Time (AHT) is the average duration of a customer call, including talk time and after-call work. It's a key indicator of efficiency, but doing it well is a balancing act. Agents should ensure they deliver the best possible CX rather than just powering through the call as fast as possible.
For example, if an agent spends 5 minutes on a call and another 2 minutes completing after-call work, the AHT for that call is 7 minutes.
To improve AHT, train agents to handle calls more efficiently without compromising service quality. Utilize call scripts, automation, and self-service tools to resolve routine issues quickly. Analyzing AHT trends can also highlight bottlenecks, enabling you to adjust processes and improve efficiency.
9. Agent Turnover
Agent Turnover refers to the rate at which call center agents leave their positions voluntarily or involuntarily. High turnover can be costly in terms of recruitment, training, and the potential impact on service quality. For example, if 15 out of 100 agents leave within a month, the turnover rate is 15%.
High turnover often indicates poor employee satisfaction, leading to decreased morale, burnout, and, ultimately, poor customer service. It can also disrupt operations and lead to increased recruitment and training costs.
To reduce turnover, create a positive work environment by offering competitive pay, recognizing performance, and providing career development opportunities. Additionally, focus on improving agent engagement by regularly seeking feedback and addressing concerns. Offering work-life balance initiatives can also help retain talent and boost job satisfaction.

10. Call Transfer Rate
The Call Transfer Rate measures the percentage of calls transferred from one agent to another or to a different department. High transfer rates may indicate inefficiencies or gaps in agent training. For example, if a customer has to speak with multiple agents before getting their issue resolved, it results in a higher call transfer rate.
Frequent call transfers can frustrate customers and prolong resolution times, negatively impacting satisfaction. They may also signal that agents lack the necessary training or authority to resolve issues independently.
To reduce call transfers, invest in cross-training your agents to handle a wider range of issues. Also, improving call routing systems ensures that calls are directed to the most suitable agents.
11. Self-Service Success Rate
Self-Service Success Rate measures the percentage of customers who successfully resolve their issues through self-service options, such as Interactive Voice Response (IVR) systems, FAQs, or chatbots, without needing agent assistance.
A high self-service success rate can reduce call volume, allowing agents to focus on more complex issues. For example, if 75% of customers use the IVR system to resolve their issue without speaking to an agent, this is considered a high self-service success rate.
To increase self-service success, ensure that self-service tools are intuitive, regularly updated, and capable of handling a wide range of customer inquiries. Monitor customer feedback to identify common issues or gaps in your self-service options and continuously improve them.
12. Agent Utilization Rate
Agent Utilization Rate measures the percentage of time agents spend actively engaged in productive work (e.g., handling calls or after-call work) versus idle time.
High agent utilization indicates that agents are being effectively utilized, maximizing productivity. However, it's essential to ensure agents aren't overworked, as this can lead to burnout and lower service quality.
To optimize agent utilization, implement workforce management software to balance agent schedules based on peak call times and demand. Regularly monitor performance and idle time to ensure that agents are engaged during their shifts while also ensuring that they aren't overburdened.