SQM Group logo

Business Case for mySQM™ Auto QA Solution

Using mySQM™ Auto QA tool, our clients' financial ROI is up to 600%, and many clients increase their CSat/FCR performance, reducing repeat calls by up to 10%.

Click the below link to determine your QA ROI potential in just a few minutes.

Calculate Your ROI Now

The Business Case for mySQM™ Auto QA Solution

Customers love us, and we experience 95% client retention because over 70% of our clients improve customer satisfaction using our mySQM™ Auto QA solution. mySQM™ Auto QA software is specifically designed for call center agents to help them deliver great customer service and lower their QA costs.

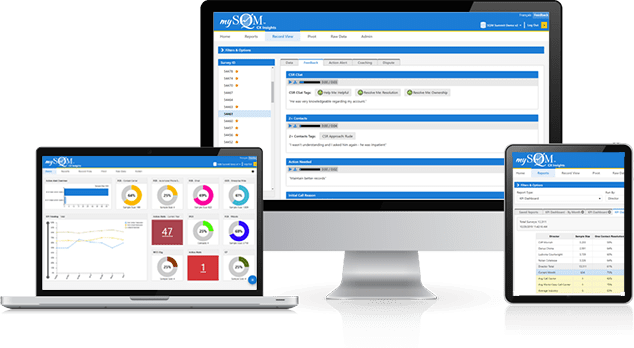
The primary metrics captured in our mySQM™ Auto QA software are a Total QA Score, Predicted Customer Satisfaction Score, Call Resolution, Customer Service, and Call Compliance metrics at the agent, supervisor, and call center levels.

Furthermore, these metrics are extremely effective at measuring and identifying the areas to improve service and cost. These metrics are also a leading indicator of improving customer journey metrics (e.g., company satisfaction, customer experience, etc.) and business outcome metrics (e.g., Net Promotor Score®, Net Retention Index, etc.).

Our high-value Auto QA solution helps call centers improve their customer service and lower operating costs by using the following:

  • Core Standard Features: auto QA scoring, data analytics, data visualization, customizable, real-time notifications, recorded customer feedback, and benchmarkable QA and predictive CSat scores.
  • Personalized Intelligence™ Features: CX benchmarking, recognizing & rewarding, agent self-training, and agent self-coaching.

Benefits of mySQM™ Auto QA Solution

Lower QA Costs

As a result of our mySQM™ Auto QA tool, our clients' financial ROI is up to 600%, and the payback period is 3 months or less. Using our Auto QA, you will reduce your quality assurance costs and improve your call center customer satisfaction (CSat). Many clients increase their CSat/FCR performance, reducing repeat calls by up to 10%. 

A person using a call centers services

Reduce Agent Costs

In addition, for the average midsize call center, every 1% improvement in their FCR performance equals $286,000 in annual operational savings. In many cases, the operational savings that clients experience by partnering with SQM to improve their FCR are far greater than the savings shown in your report when moving from a manual to an auto QA program.  

a infographic of charts and graphs with money

Reduce Operating Costs

For every 1% improvement in FCR, you reduce your operating costs by 1%.

  • For a call center performing at the FCR industry average of 70%, potentially 30% of customers will have to call back because their issue was not resolved on the first call.
  • For the average call center, it takes 1.4 calls to resolve a customer’s inquiry. For 30% of customers who do not achieve FCR, it takes 2.5 calls to resolve their inquiry.
  • Repeat calls represent 23% of the average call center’s operating budget, which is an enormous opportunity to reduce a call center’s operating costs.
  • For the average midsize call center, a 1% improvement in their FCR performance equals $286,000 in annual operational savings.
A report with a graph and stacks of money behind it.

Reduce Customers at Risk of Defection

95% of customers will continue to do business with the organization as a result of achieving FCR.

  • If the call was unresolved, 23% of customers express their intent to not continue to use the organization’s products and services as a result of their call center experience.
  • It costs five times more to attract a new customer than it does to retain one.
  • For many call centers, retaining customers represents the biggest opportunity to add true value to their organization.
  • Resolving calls is the key to reducing customers at risk.
  • For every 2% improvement in FCR there is a 1% improvement in call resolution, helping the call center retain customers.
A CSR with ratings around her. A man is transferring money with is phone.

Improve Customer Satisfaction

For every 1% improvement in FCR there is a 1% improvement in Csat.

  • FCR is the metric with the highest correlation to Csat out of all call  center internal or external metrics.
  • The absence of FCR is the strongest driver of customer dissatisfaction.
  • Csat (top box response) average drops 15% every time a customer has to call back to get their initial call resolved.
  • If a customer had to call in three times to get their call resolved, their Csat would be 30% lower than a customer who had their call resolved on the first call.
  • On average, 14% of customers describe their call as a complaint call. For every 5% improvement in FCR you reduce your complaint calls by 1%.

a customer satisfacation gauge with a call center rep in front. Heart icons and a graph is in the background.

Improve Employee Satisfaction

For every 1% improvement in FCR there is a 1% to 5% improvement in Esat.

  • Call centers with high FCR tend to have high Esat. Conversely, call centers with low FCR tend to have low Esat.
  • The level of stress is very high for the agent who handles the second or third call when a customer’s issue was unresolved on the first call.
  • Increasing FCR improves both Esat and Csat. Consistently resolving inquiries on the first call can increase Esat substantially.
  • Most call center managers understand that high Esat can provide high Csat/FCR, but high Csat/FCR can drive high Esat too.
Employees with reports and statistics

Increase Opportunities to Sell

When a customer's call is resolved the customer cross-selling acceptance rate increases by up to 20%.

  • SQM’s research shows that the customer’s needs must be resolved before the agent has earned the right to move on to any type of sales activity.
  • If the agent cross-sells before the inquiry or problem is resolved, the customer typically becomes irritated.
  • The customer can feel that the organization is pushing its needs, rather than serving the customer’s needs.
  • Focusing on business needs versus customer needs can cause the fundamental customer relationship to be undermined.
A person in front of a product offering with a phone and credit cards.

Improve Net Promoter Score®

For the average call center, every 1% improvement in FCR increases transactional NPS by 1.4.

  • The average call center FCR is 72% and their NPS is 48
  • FCR and NPS have a high correlation of .64
  • NPS goes down by 18 points for each additional call made
  • NPS is 64 points when customers resolved their call in one call (FCR)
  • NPS is 40 points when customers resolved their call in two calls
  • NPS is - 10 points when customers call is unresolved on the first call
Net Promoter Score Icon

Request a mySQM™ Customer Service QA Demo Video

Learn about SQM's agent… Csat prediction model, which is based on standardized metrics, AI, and regression analysis to predict customer satisfaction derived from a QA evaluation. Our Csat prediction model provides a high statistical correlation, translating to a 95% success rate in predicting agent Csat in most cases.

4.6 a gold star a gold star a gold star a gold star a gold star
Stars on G2 for mySQM™ Auto QA Tool Reviews

What Differentiates SQM from its Competitors is...

mySQM™ Automated QA Solution uses proprietary technology and intellectual property to determine QA scores and predict benchmarkable customer satisfaction for every call. mySQM™ QA also provides agents with self-coaching, self-training, and real-time financial recognition features for calls evaluated to help monitor, motivate, and manage agents to deliver great customer satisfaction.

mySQM™ Auto QA ROI Calculator

Discover Your Savings in Minutes

Automate QA to Improve Csat and Reduce Costs to Score

mySQM™ automated QA tool can lead to an ROI of up to 600%, improve customer satisfaction scores, and reduce repeat calls by up to 10%.

Increased Efficiency: Call centers with effective QA practices achieve a 5-15% higher FCR rate, resulting in fewer callbacks and, on average, operational savings of $286,000 for every 1% improvement in FCR. With every 1% improvement in FCR, customer satisfaction rates improve 1%.